1 Quarto-Shinylive
Shinylive allows you to run Shiny applications entirely in a web browser, without the need for a separate server running Python.
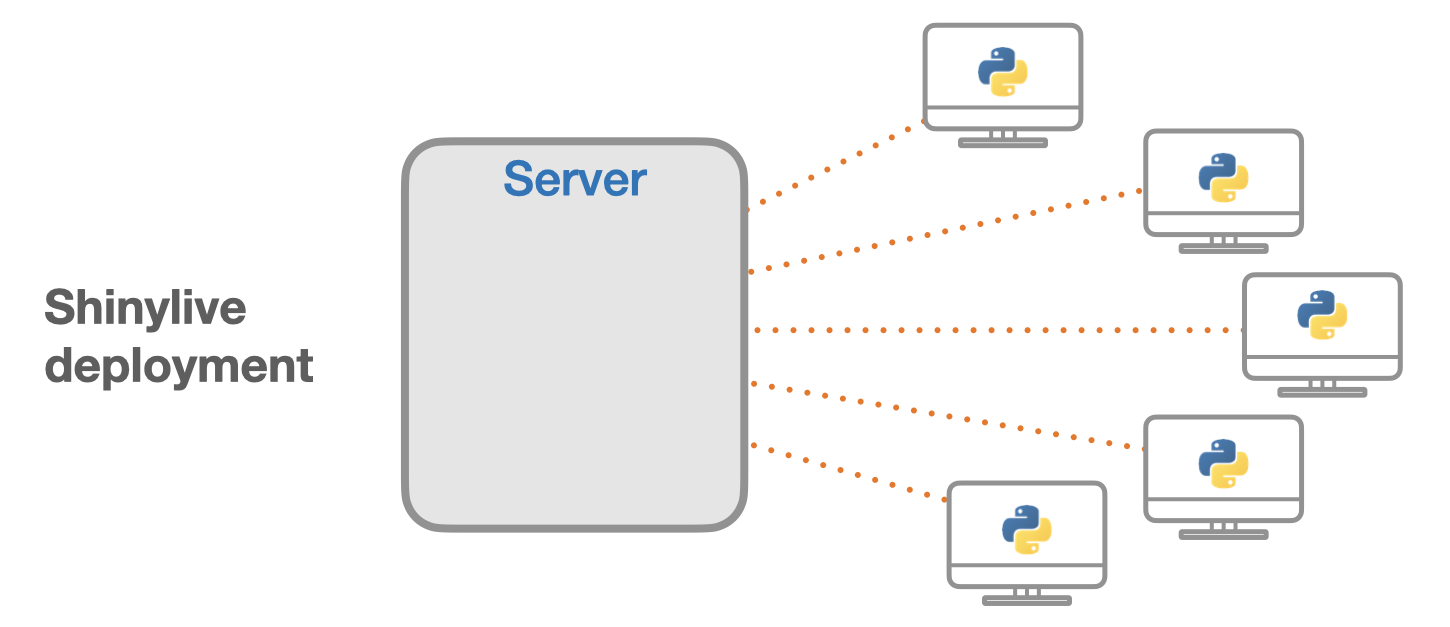
The traditional way of deploying Shiny involves in a separate server and client: the server runs Python/R and Shiny, and clients connect via the web browser. Each client keeps an open websocket connection as long as they are using the application.
When an application is deployed with Shinylive, Python/R and Shiny run in the web browser: the browser is effectively both the client and server for the application. There is a web server that serves files, but it does not run Python/R or Shiny: it can be a “dumb” static web server.
However, there’s a downside. The overhead i.e., the speed for configuring the web browser of local machine is painfully slow.
This example takes up to 50 seconds for the loading. So, please be patient.
I render this post using GitHub Actions only. So you can reproduce this by just forking/cloning this repository.
1.1 Locations of Earthquakes off Fiji
The data set give the locations of 1000 seismic events of MB > 4.0. The events occurred in a cube near Fiji since 1964. There are two clear planes of seismic activity. One is a major plate junction; the other is the Tonga trench off New Zealand. These data constitute a subsample from a larger dataset of containing 5000 observations.
This is one of the Harvard PRIM-H project data sets. They in turn obtained it from Dr. John Woodhouse, Dept. of Geophysics, Harvard University.
#| '!! shinylive warning !!': |
#|   shinylive does not work in self-contained HTML documents.
#|   Please set `embed-resources: false` in your metadata.
#| standalone: true
#| viewerHeight: 1000


library(shiny)
library(leaflet)
library(RColorBrewer)

ui <- bootstrapPage(
  tags$style(type = "text/css", "html, body {width:100%;height:100%}"),
  leafletOutput("map", width = "100%", height = "100%"),
  absolutePanel(top = 10, right = 10,
    sliderInput("range", "Magnitudes", min(quakes$mag), max(quakes$mag),
      value = range(quakes$mag), step = 0.1
    ),
    selectInput("colors", "Color Scheme",
      rownames(subset(brewer.pal.info, category %in% c("seq", "div")))
    ),
    checkboxInput("legend", "Show legend", TRUE)
  )
)

server <- function(input, output, session) {

  # Reactive expression for the data subsetted to what the user selected
  filteredData <- reactive({
    quakes[quakes$mag >= input$range[1] & quakes$mag <= input$range[2],]
  })

  # This reactive expression represents the palette function,
  # which changes as the user makes selections in UI.
  colorpal <- reactive({
    colorNumeric(input$colors, quakes$mag)
  })

  output$map <- renderLeaflet({
    # Use leaflet() here, and only include aspects of the map that
    # won't need to change dynamically (at least, not unless the
    # entire map is being torn down and recreated).
    leaflet(quakes) %>% addTiles() %>%
      fitBounds(~min(long), ~min(lat), ~max(long), ~max(lat))
  })

  # Incremental changes to the map (in this case, replacing the
  # circles when a new color is chosen) should be performed in
  # an observer. Each independent set of things that can change
  # should be managed in its own observer.
  observe({
    pal <- colorpal()

    leafletProxy("map", data = filteredData()) %>%
      clearShapes() %>%
      addCircles(radius = ~10^mag/10, weight = 1, color = "#777777",
        fillColor = ~pal(mag), fillOpacity = 0.7, popup = ~paste(mag,"진도")
      )
  })

  # Use a separate observer to recreate the legend as needed.
  observe({
    proxy <- leafletProxy("map", data = quakes)

    # Remove any existing legend, and only if the legend is
    # enabled, create a new one.
    proxy %>% clearControls()
    if (input$legend) {
      pal <- colorpal()
      proxy %>% addLegend(position = "bottomright",
        pal = pal, values = ~mag
      )
    }
  })
}

shinyApp(ui, server)
Credit: Using Leaflet with Shiny
2 Quarto-Live
2.1 Interactive R
2.1.1 Mergesort from scratch
I coded this while teaching myself computer science.
I think it is important to understand how the “so-called” the basis functions work when it comes to the programming.
You can play around with it. Plus, you can modify the code for a better understanding.
2.2 Non-interactive
Code
cat("And, this is a non-interactive cell", fill = TRUE)And, this is a non-interactive cell
